SQL & Analytics
SQL warehouses, dashboards and a query history you can trust.
Interactive SQL on Trino over your governed tables and federated sources, from warehouses that scale to zero and bill by the second. Preview what a query will scan before it runs, chart the answer on a dashboard, and find every statement again in a history with its plan.
The advantages
The outcomes this product is built around.
Know the cost before you run it
Every statement can be previewed first: the SQL that would actually run, after policy, and the bytes it would scan.
Warehouses that stop when you do
SQL warehouses by size, autoscaling with scale-to-zero, billed per second by the SKU you chose.
Every tile runs as the viewer
Dashboards and query results are filtered by the same row and column rules as the person looking at them, so one dashboard serves everyone safely.
Questions in plain language, SQL you can check
Ask in words and get SQL grounded in your semantic layer — always shown, and permission-checked before it runs.
- billing grain for every warehouse, by size
- 1 s
- warehouses running when idle, with scale-to-zero
- 0
- warehouse sizes, extra small to extra large
- 5
See it in the console
Real screens from the product, not mock-ups.
Type it, run it, read it
A query over a governed table, answered in the editor and kept in the history.
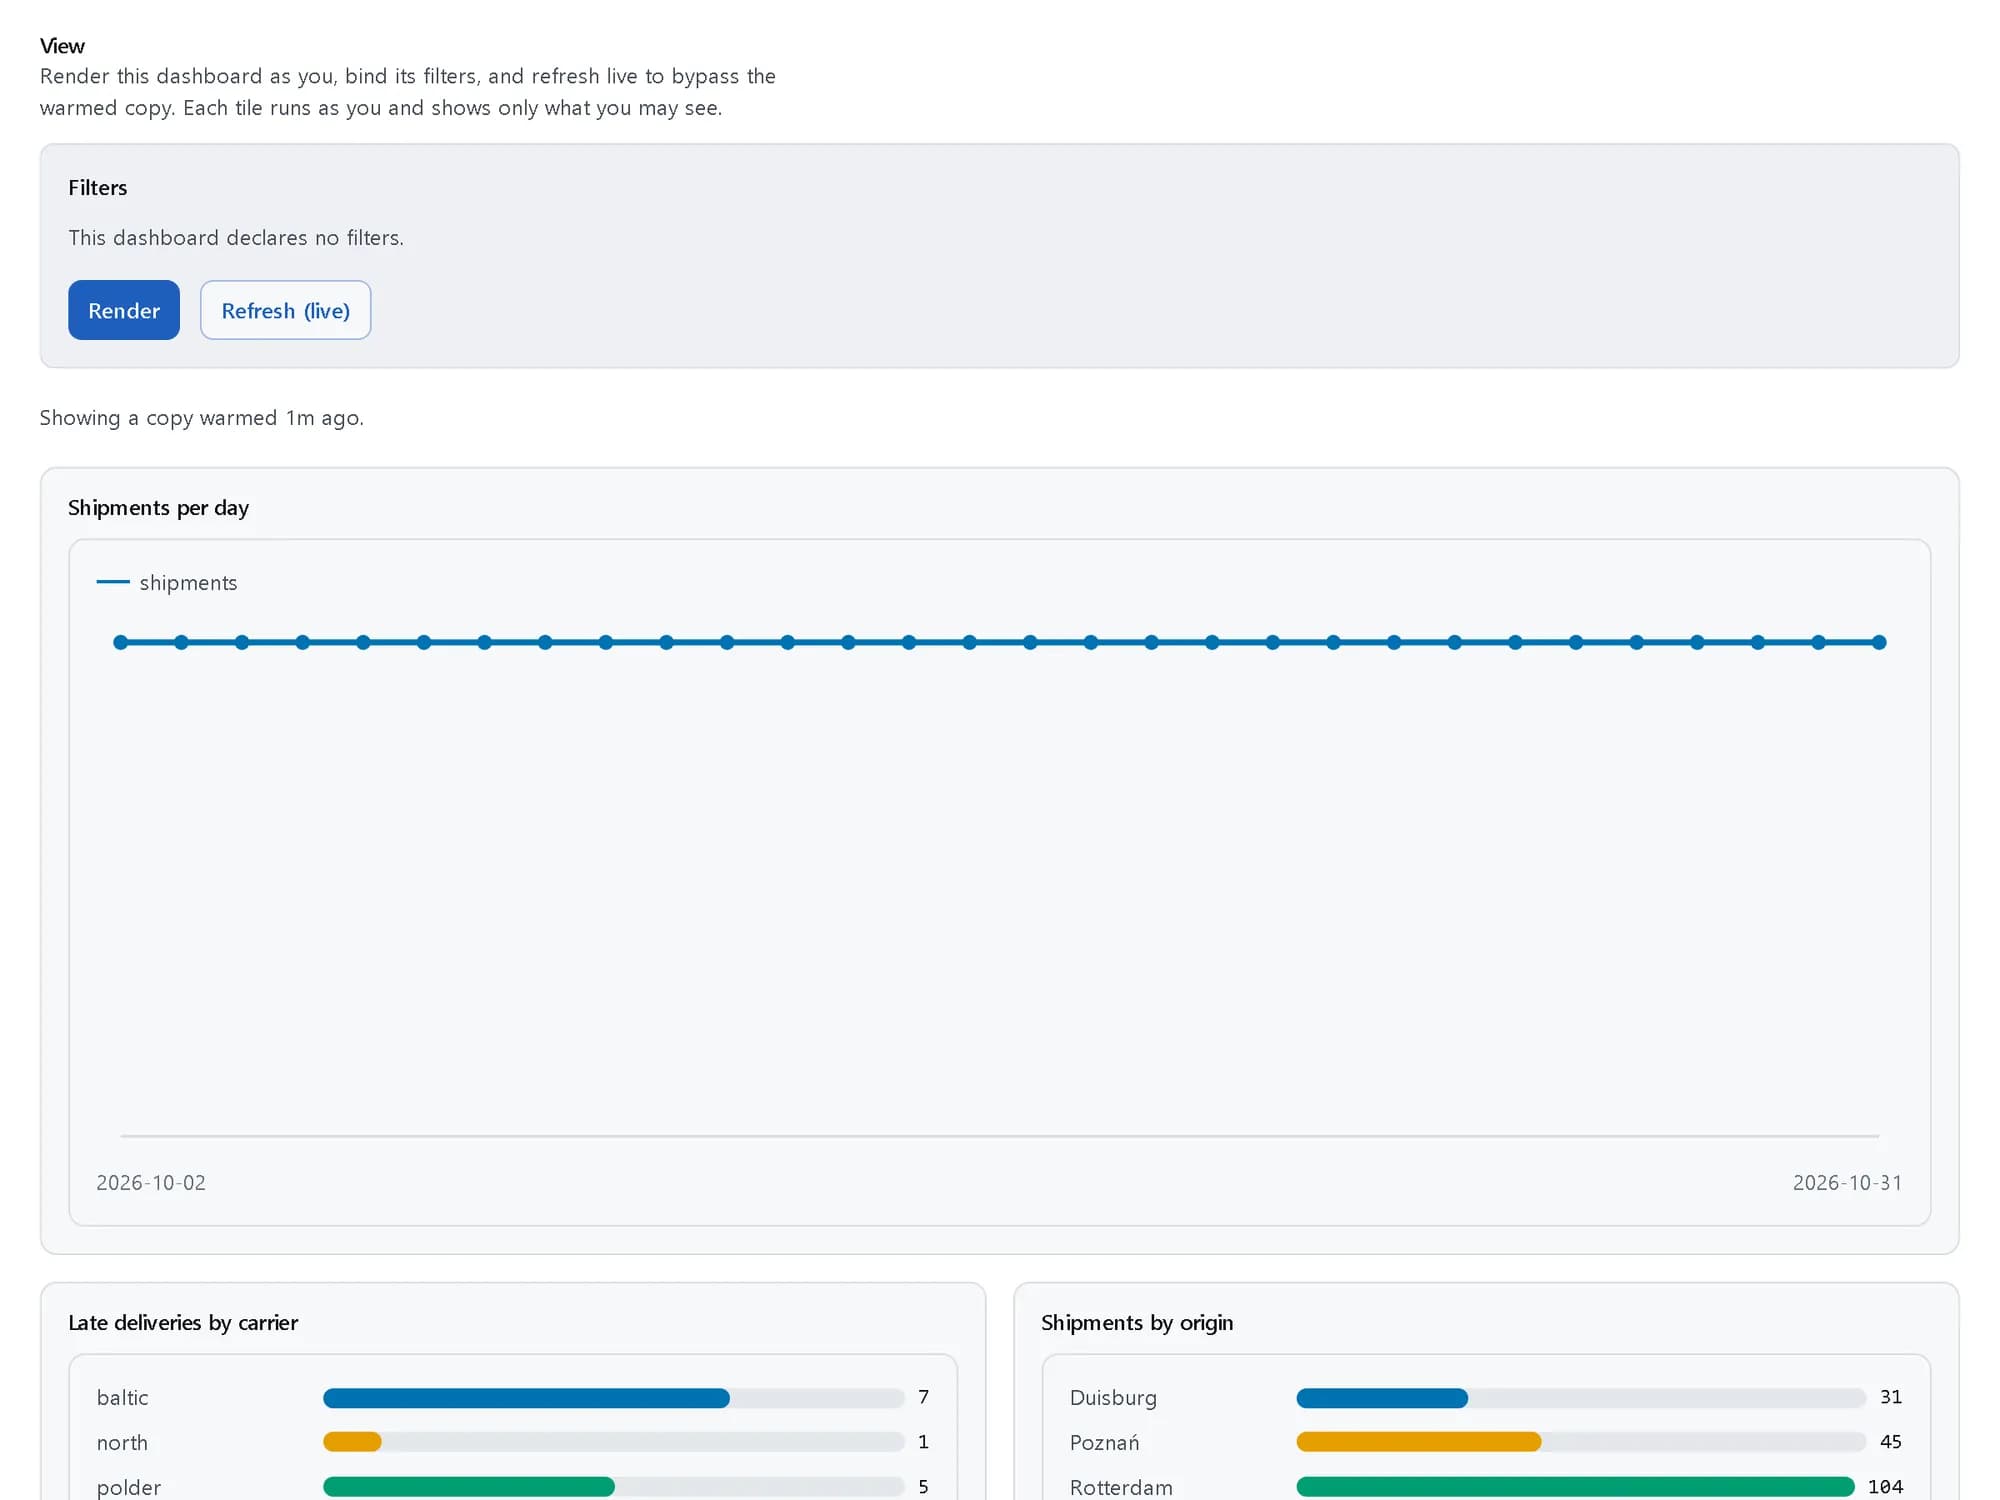
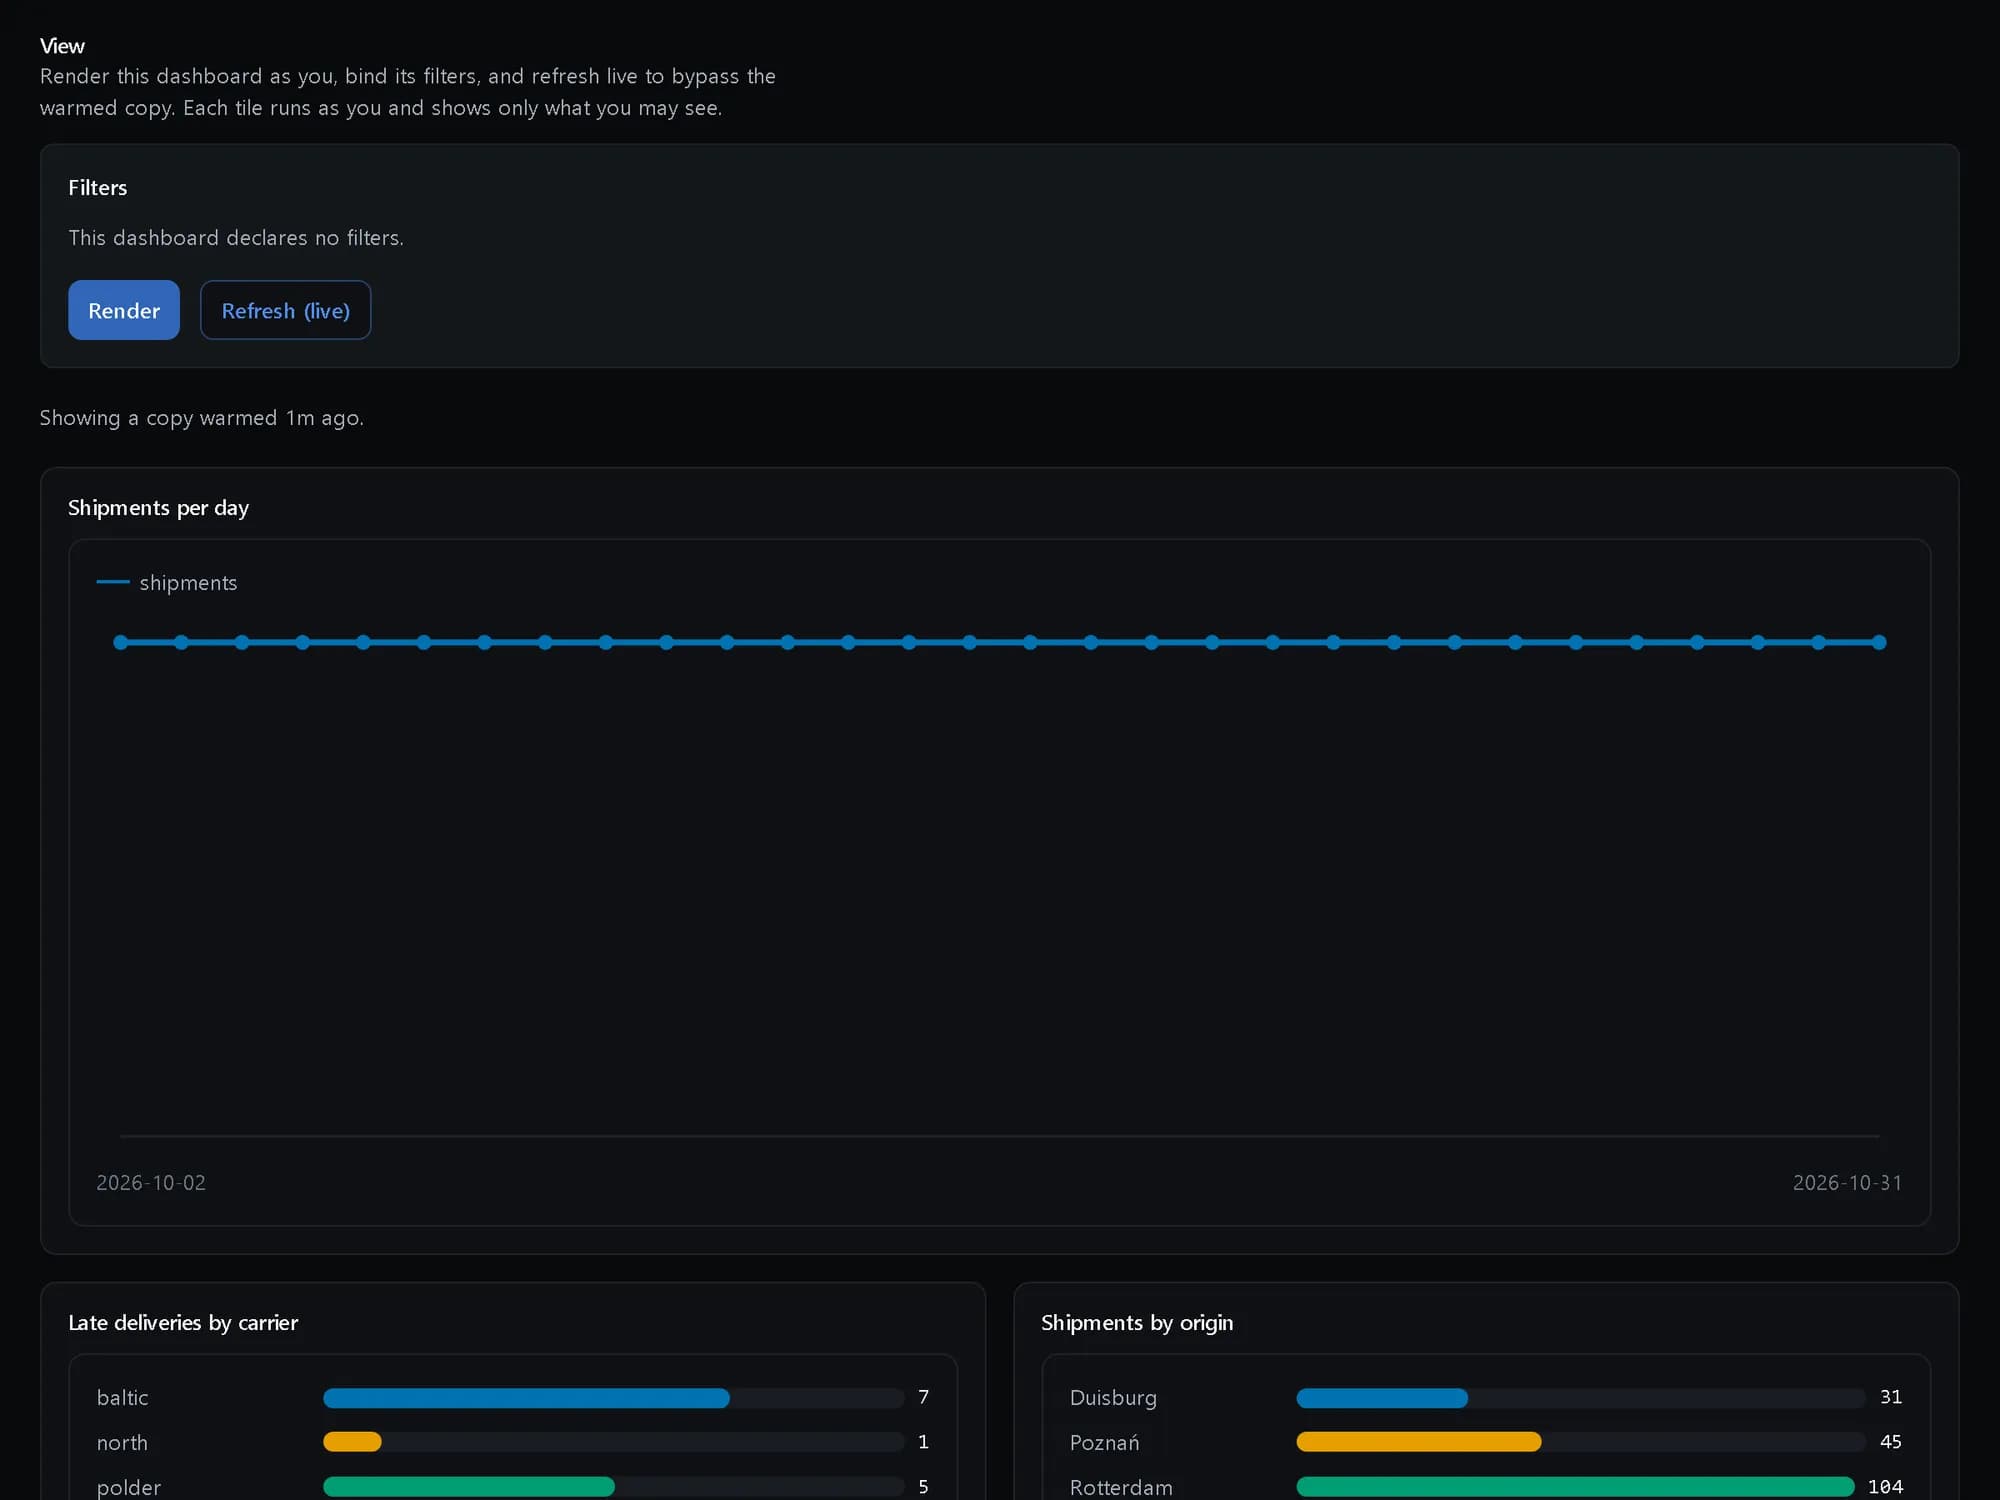
A dashboard for everyone
Lines, bars and counts, each tile running as whoever opens it.
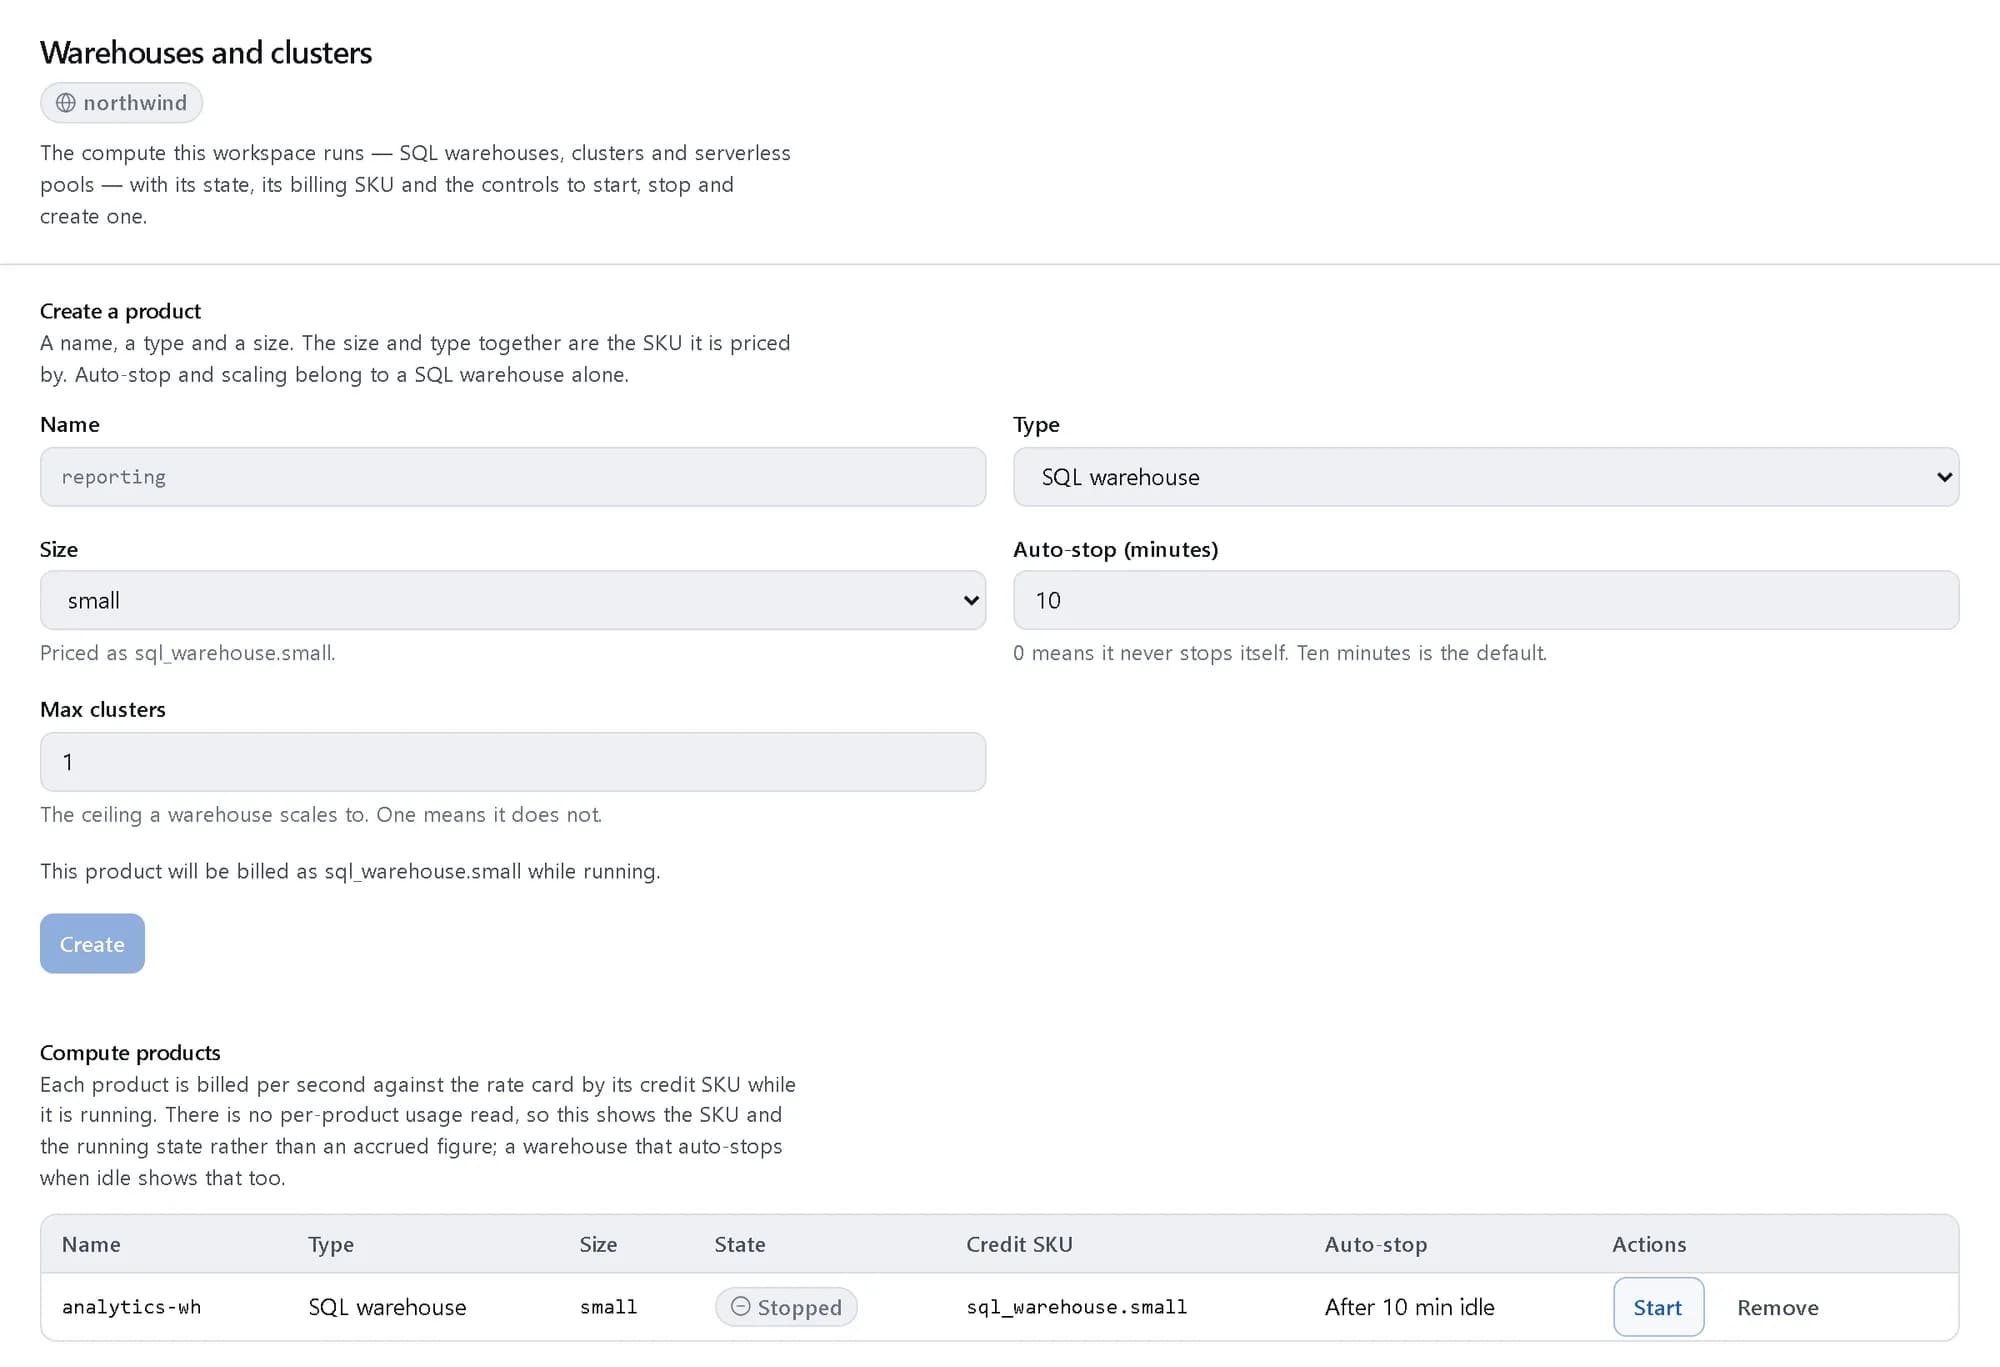
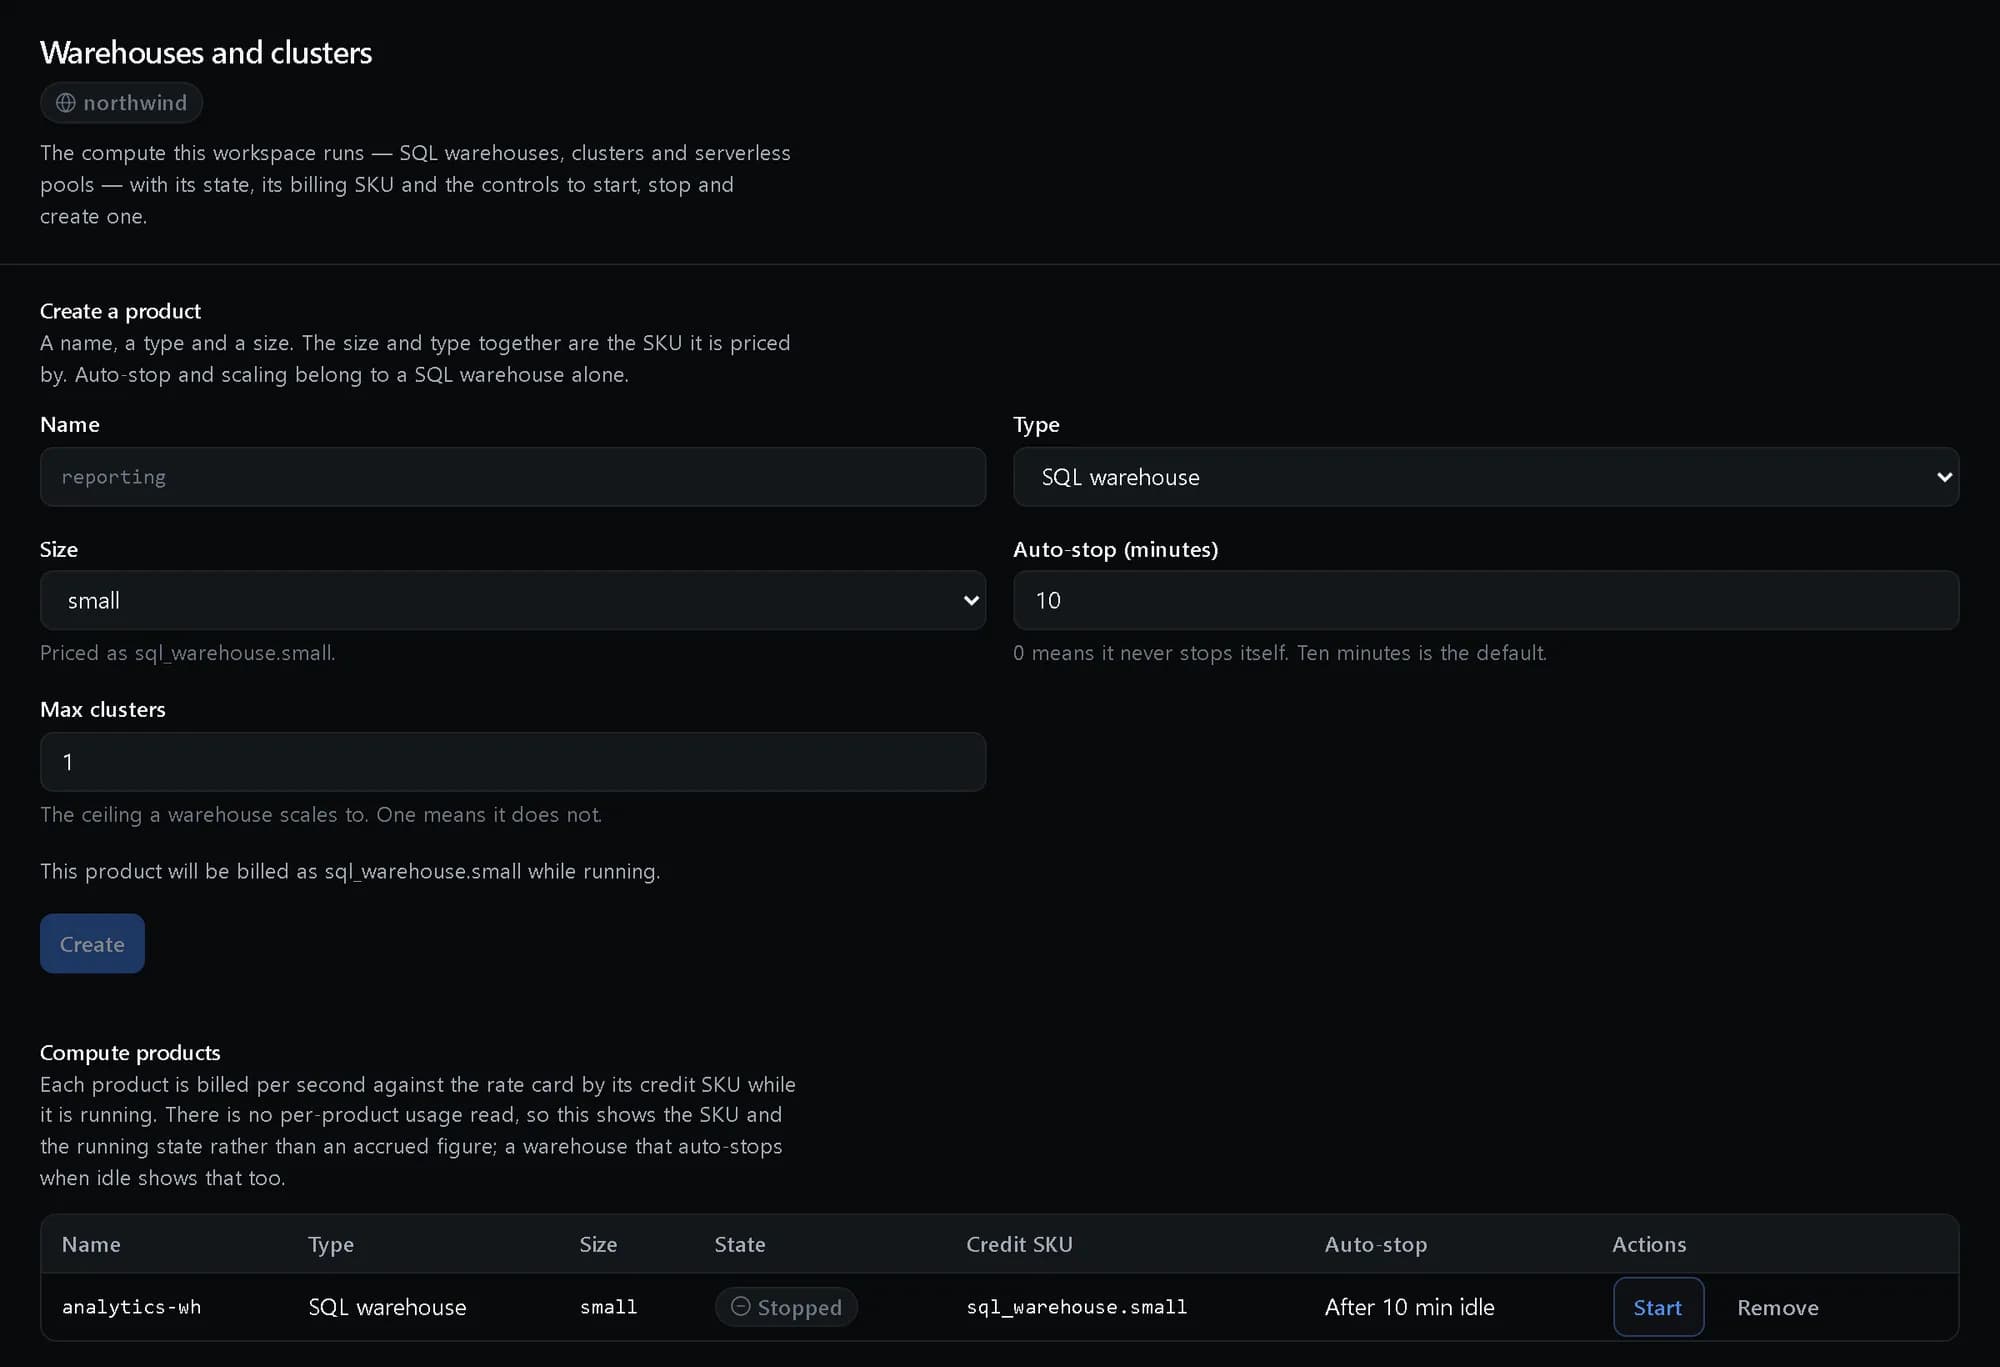
Warehouses by the second
Each warehouse with its size, its billing SKU and when it stops itself.
How it fits together
What happens between your request and a running resource.
A statement from the editor, a dashboard tile or a BI tool is planned first: policy rewrites it to the rows and columns the asker may see and the cost is estimated. A warehouse then runs it on Trino, and the result and its plan are kept in the history.
- Editor or BI tool: SQL · JDBC · ODBC (You)
- Dashboard tile: runs as the viewer (You)
- Plan and policy: rewrite · cost preview (The platform)
- Query history: with plans (The platform)
- SQL warehouse: Trino, scales to zero (Compute)
- Editor or BI tool to Plan and policy
- Dashboard tile to Plan and policy
- Plan and policy to SQL warehouse: runs
- Plan and policy to Query history
Who it is for
The teams and situations this product was built for.
Analysts
Answers from governed tables without waiting for an extract.
An editor with the schema you may read, a cost preview, and results you can export or chart.
Operations leads
A dashboard the whole team can open without anyone seeing more than they should.
Dashboards whose every tile runs as the viewer, with scheduled refresh and drill-down.
Finance and platform owners
SQL spend that does not run all weekend.
Warehouses that scale to zero, queues with limits, and queries killed by policy on runtime or cost.
What it does
The core capabilities, live in the product today.
Interactive SQL on Trino, with federation
Query governed tables and external sources together, with an editor that browses the schema you may read and keeps your history.
Trino runs the statement over your Iceberg tables and, through federation, over the sources you connect. The editor shows only what your grants reach, and every statement lands in a searchable history with its plan.
Warehouses, queues and limits
Warehouses by size with autoscaling and scale-to-zero, queues with priority and concurrency limits, and kills on demand or by policy.
A warehouse grows with the queue and stops when idle. Queues decide who runs first and how many at once, and a query that runs too long or would cost too much is stopped by policy rather than by someone noticing the invoice.
Dashboards and alerts
Charts, filters, drill-down and scheduled refresh in a colour-blind-safe palette, plus alerts on query results by threshold or anomaly.
A dashboard is a set of tiles, each a query and a chart, that runs as whoever opens it. Refresh it on a schedule, drill from a bar into the rows behind it, and alert when a result crosses a line.
Your BI tools, connected
Connect over JDBC and ODBC; result caching and materialized views keep repeated questions fast.
Existing BI tools connect over JDBC and ODBC and read through the same rules as the editor. Repeated queries are answered from the result cache, and heavy ones can be materialized.
The ideas behind it
The words this page uses, explained once.
- SQL warehouse
- A named pool of SQL compute with a size and an auto-stop. Its type and size are the SKU it is billed by, per second, while it runs. Read more: SQL warehouse
- Cost preview
- What a statement would do before it does it: the SQL after policy, and an upper bound on the bytes it would scan.
- Federation
- Querying an external source alongside your own tables in one statement, without copying it in first.
In depth
The detail an evaluation asks for.
Policy in the plan
Row filters and column masks are applied to the query plan, so the editor, dashboards, BI tools and the API all see the same narrowed answer.
Spend controls
Queues set priority and concurrency, a query can be killed on demand or by policy on runtime or cost, and compute is held when the credit balance runs out.
Natural language, checked
Questions in plain language become SQL grounded in the semantic layer. The SQL is always shown, and permission-checked before it runs.
How it works
- Console
Start a warehouse
Choose a size and an auto-stop; the size and type are the SKU it is billed by, per second.
- SQL
Preview, then run
See the SQL policy will run and what it will scan, then run it and export the rows.
- Console
Chart it
Save tiles to a dashboard, refresh it on a schedule and drill into the rows.
- API
Find it again
Every statement is in a searchable, shareable history with its plan and profile.
In code
The same task in the CLI and both SDKs. Every call shown exists in the API.
prx CLI
Start a SQL warehouse, preview a query’s cost and run it
prx lakehouse compute-product create --workspace default --body '{"name":"analytics-wh","product_type":"sql_warehouse","compute_type":"small","auto_stop_seconds":600}'prx lakehouse query queries-plan --body '{"sql":"SELECT carrier_id, count(*) AS shipments FROM logistics.shipments GROUP BY carrier_id"}'prx lakehouse query create-queries --body '{"sql":"SELECT carrier_id, count(*) AS shipments FROM logistics.shipments GROUP BY carrier_id"}'TypeScript SDK
Start a SQL warehouse, preview a query’s cost and run it
await client.lakehouse.computeProduct.create({ name: 'analytics-wh', product_type: 'sql_warehouse', compute_type: 'small', auto_stop_seconds: 600 });const sql = 'SELECT carrier_id, count(*) AS shipments FROM logistics.shipments GROUP BY carrier_id';const { plan } = await client.lakehouse.query.queriesPlan({ sql });const { rows } = await client.lakehouse.query.createQueries({ sql });Python SDK
Start a SQL warehouse, preview a query’s cost and run it
client.lakehouse.compute_product.create({"name": "analytics-wh", "product_type": "sql_warehouse", "compute_type": "small", "auto_stop_seconds": 600})sql = "SELECT carrier_id, count(*) AS shipments FROM logistics.shipments GROUP BY carrier_id"plan = client.lakehouse.query.queries_plan({"sql": sql})["plan"]rows = client.lakehouse.query.create_queries({"sql": sql})["rows"]The difference
The way this job usually goes, and the way it goes here.
The usual way
With ProjectX
Run the query and find out what it scanned when the bill arrives.
Preview the rewritten SQL and the bytes it will scan before anything runs.
A warehouse left running over the weekend.
Warehouses that scale to zero when idle and bill per second.
One dashboard per audience, because a shared one shows too much.
One dashboard whose every tile runs as the person viewing it.
Works with your tools
Every surface below drives the same product — script it, click it, or hand it to your existing tooling.
- SQL editor
- Dashboards
- JDBC and ODBC
- API
- Python SDK
Questions, answered
Which SQL engine runs our queries?
Trino, over your Iceberg tables and, through federation, over the external sources you connect.
Can we see what a query costs before running it?
Yes. A preview returns the SQL that would actually run after policy is applied, and an upper bound on the bytes it would scan.
Do our BI tools work?
Tools that connect over JDBC or ODBC can query through the same row and column rules as the editor.
Who sees what on a shared dashboard?
Each tile runs as the viewer, so two people opening the same dashboard each see only what they are allowed to.
How is it priced?
SQL warehouses are billed per second by size at published rates in Platform Credits, and stop when idle. The rates are on the pricing page.
Products it works with
Same platform, same console, same invoice.
Start with ProjectX today.
Create a company in minutes and add this product to your invoice at the published rate.